SNECI MARKET STUDIES & INFOGRAPHICS
Our teams offer you market studies and infographics in order to analyze, understand and measure the threats, challenges and opportunities of the different sectors with which we work, whether you are an industrial or a supplier.
Discover and download our market studies and infographics to find out more about market trends and business activities !
All our Market Studies
The battery is nowadays used for many human activities and areas :
- renewable energy,
- new technologies,
- transports,
- mobility, …
Among all these fields, one tends to predominate : the lithium-ion battery.This technology, largely produced today, has shown great technological development over the last decade.
Find out more about The global battery market for green mobility by downloading our Market Sudy.
Various reasons explained the automotive industry in 2021, among them :
- The semi-conductor crisis
- The general increase in vehicle prices
- The restrictive Covid-19 measures
- The production costs
- The foreign investments
- The demand for SUVs remained particularly high
- The activity related to mass electrification
Find out more about The Automotive Industry in 2021 by downloading our Market Sudy.
All our Infographics
Hydrogen is the subject of many promises.
Abundant resources, potentially zero emissions, green mobility, electricity storage and more.
- Energy system flexibility tool
- Self-consumption of renewable energy
- Electromobility
- …
Find out more about The Hydrogen in the energy transition by downloading our Infographic.
The various developments that have enabled us to move from Industry 1.0 to 4.0
In summary:
- Mechanization
- Assembly line
- Automation
- …
Find out more about The Industrial Revolution by downloading our Infographic.
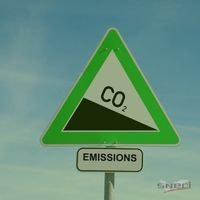
Which sectors produce the most CO2 in France
In summary :
- Waste
- Transport
- Residential / tertiary buildings
- …
Find out more about the CO2 emissions in France by downloading our Infographic.
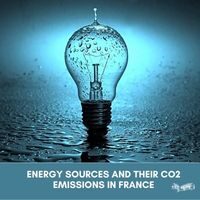
What source of energy emits CO2 and in which quantity?
- Nuclear
- Hydraulic
- Wind power
- Gas
- …
Learn more about CO2 emissions by energy source by downloading our Infographic.
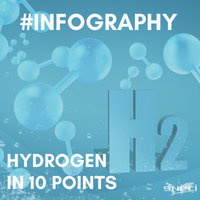
What Hydrogen can bring to industry?
- Definition
- Production
- Benefits
- Storage
- …
Learn more about Hydrogen by downloading our Infographic.
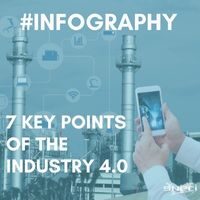
What are the 7 key points of the the Industry 4.0?
- The Human, a key actor
- Cyber-Security
- Distributed Intelligence
- Virtual reality in real time
- Flexible integration & configuration…
Learn more about the Industry 4.0 by downloading our Infographic.
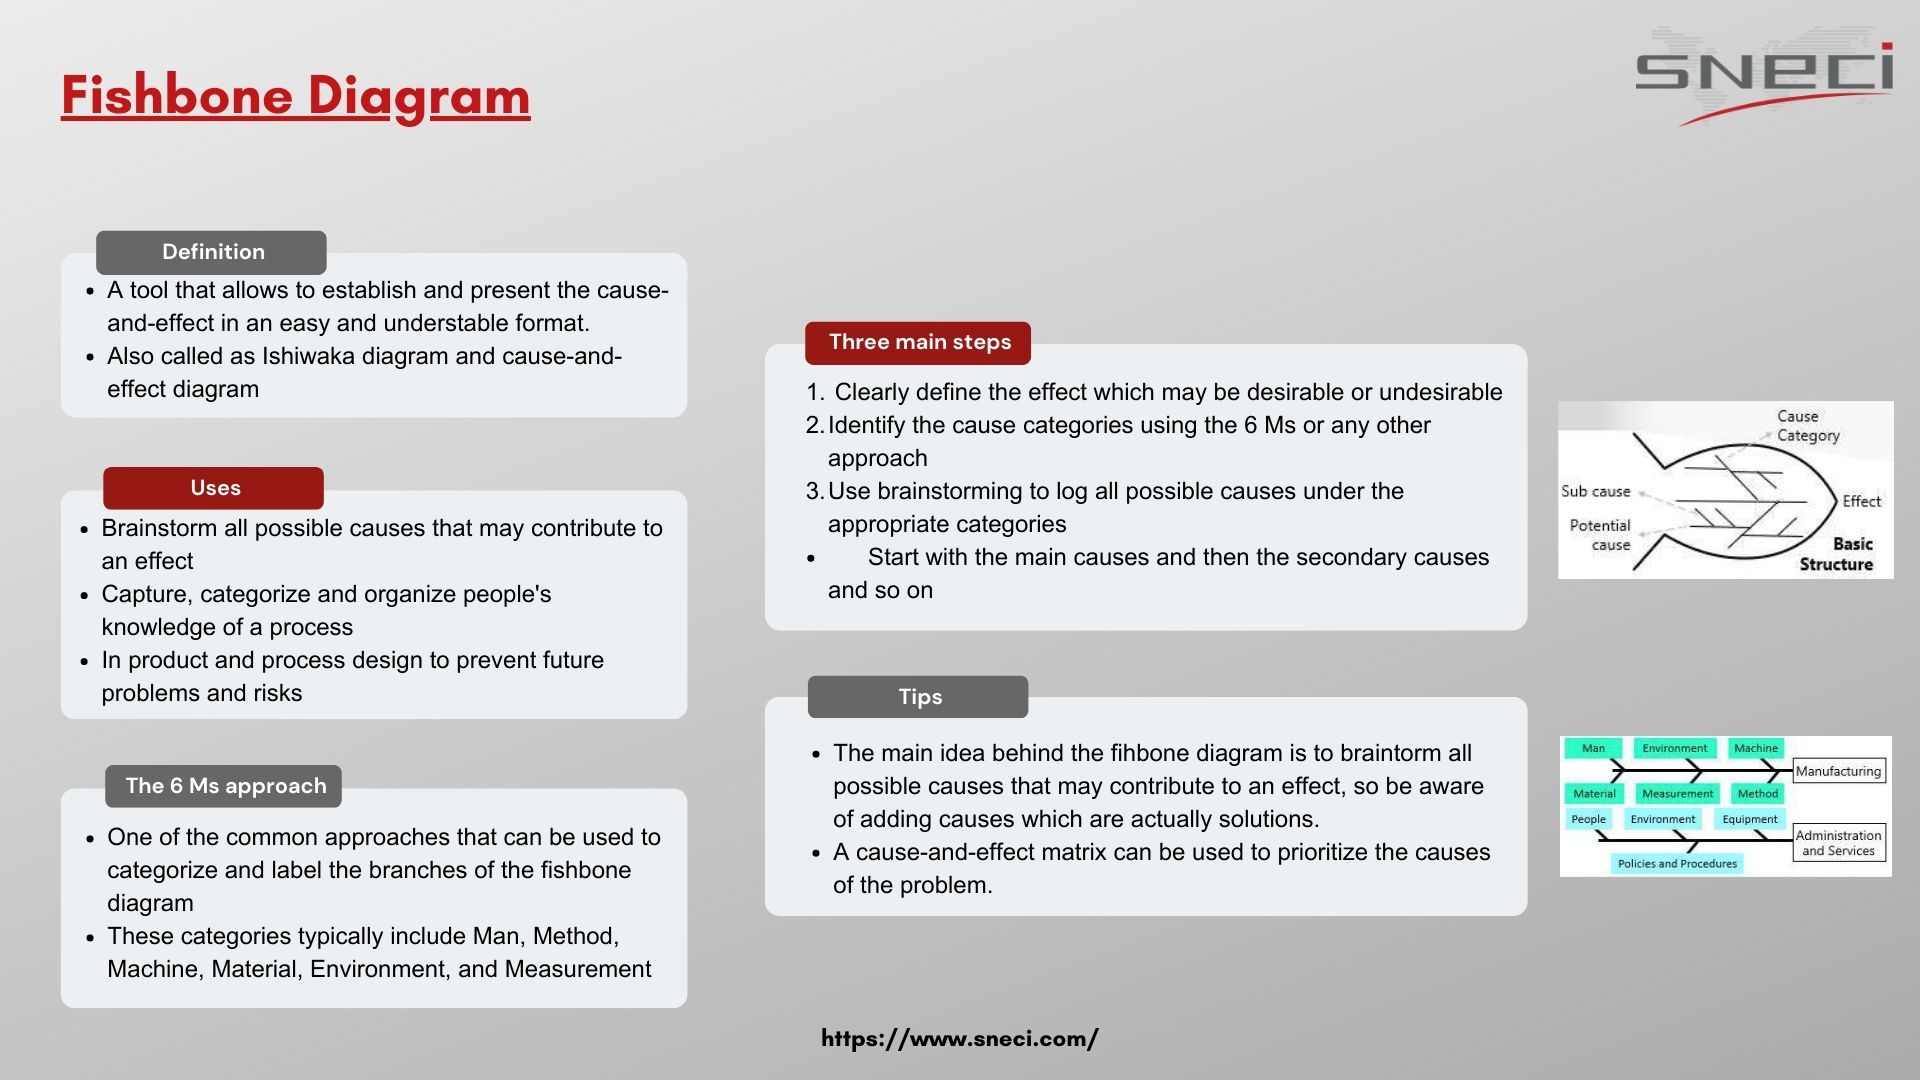
The Fishbone Diagram :
- Definition
- Use
- 6M approach
- 3 main steps…
Lear more about the Fishbone Diagram by downloading our infographic !
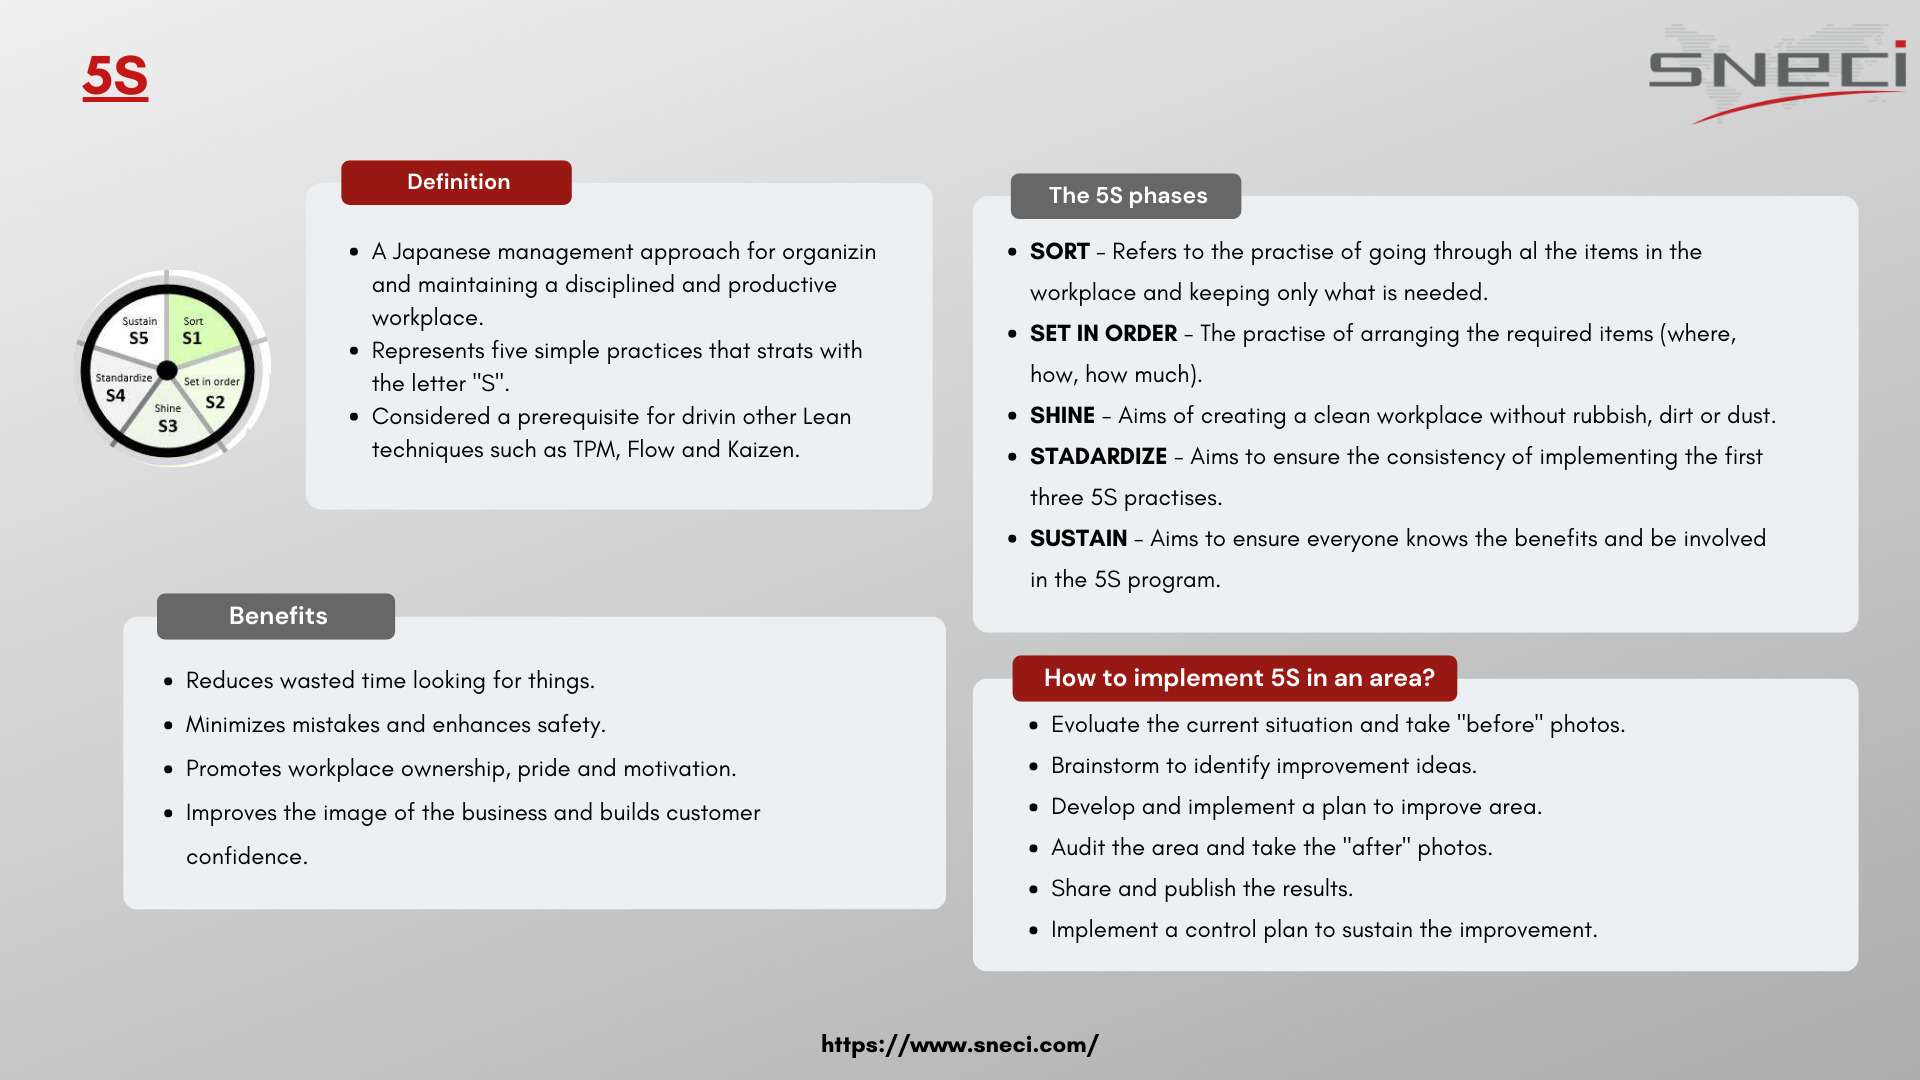
The 5S method allows to permanently optimize the working conditions and the working time by ensuring the organization, the cleanliness and the safety of a work plan.
The 5S method is of Japanese origin.
It was created for the production of Toyota factories.
The 5S method is a management technique that is part of the quality approach.
Lear more about the 5s by downloading our infographic !
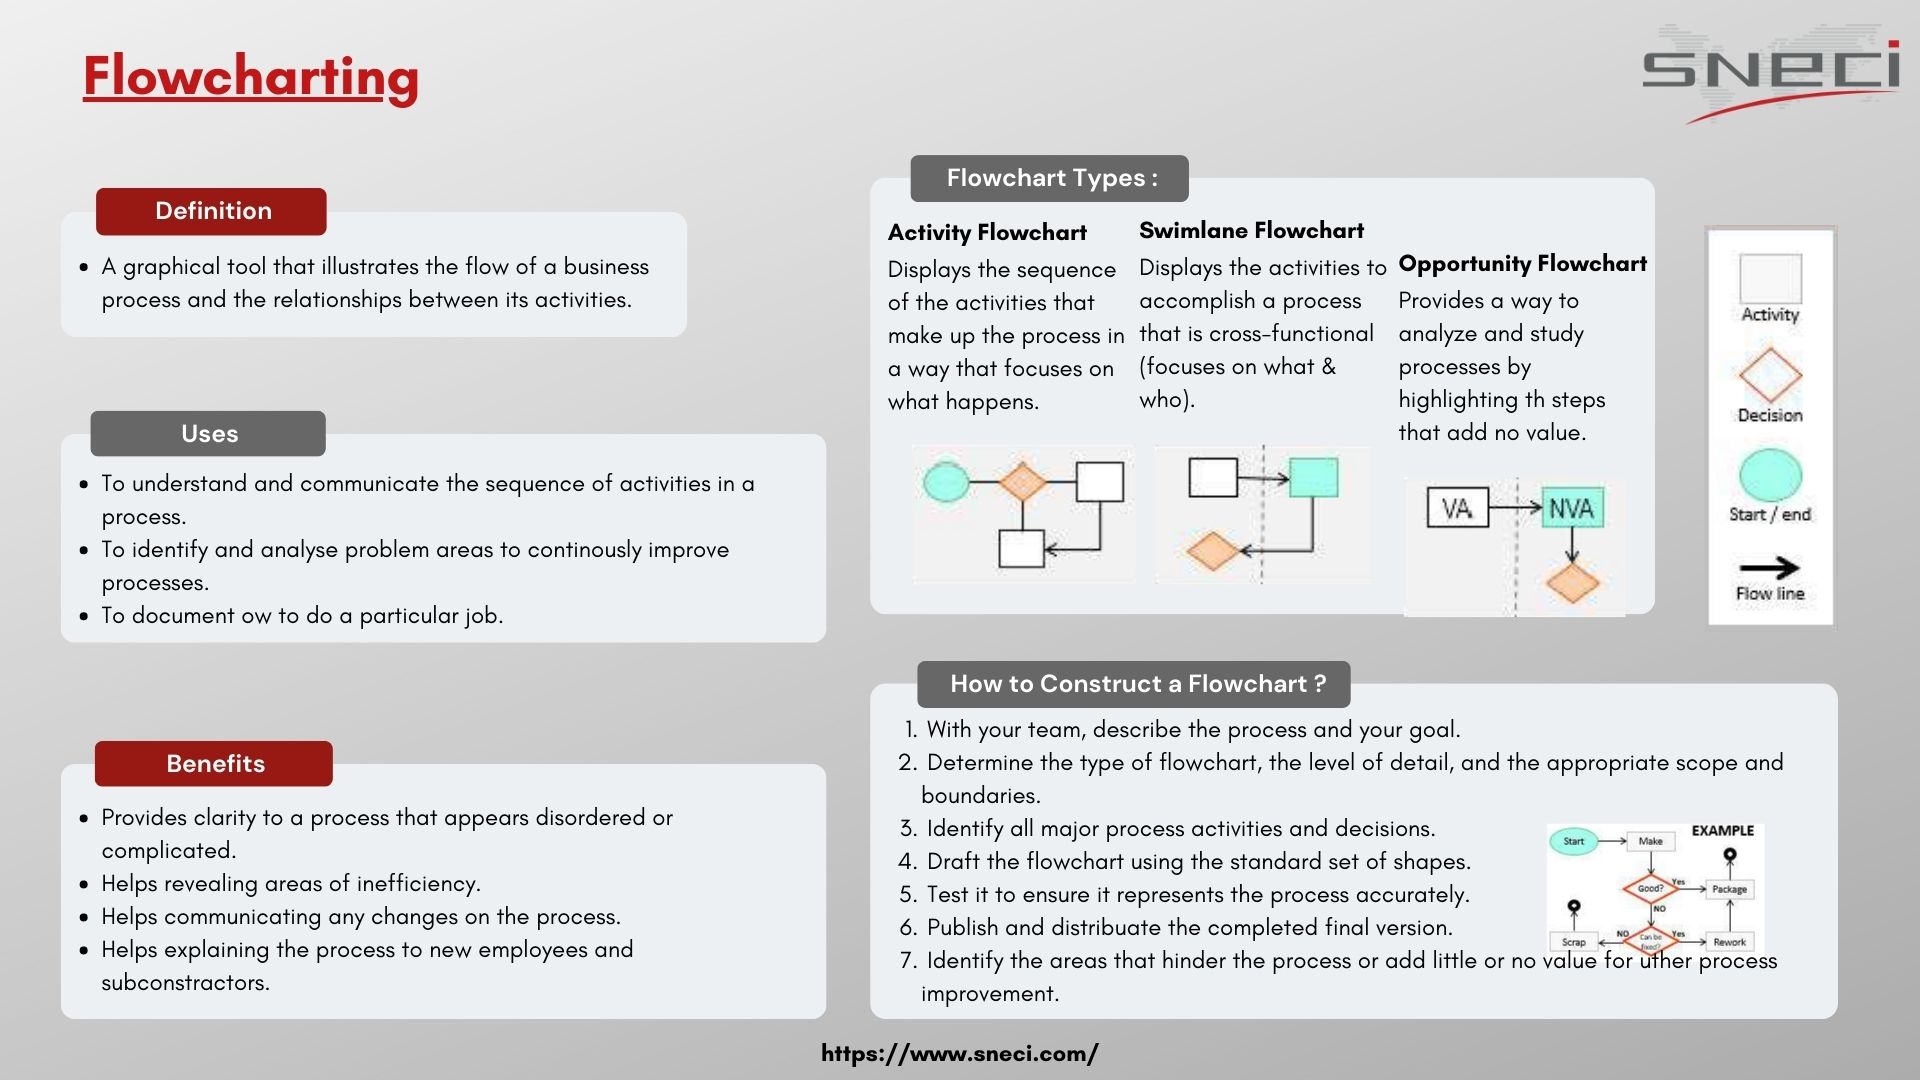
What is Flowcharting in Lean :
- Definition
- Use
- Benefits
- Types of flowcharts …
Lear more about Flowcharting by downloading our infographic !
Featured Articles

EU to impose taxes on Chinese electric vehicles
The European Union (EU) recently decided to impose additional taxes on imports of Chinese electric vehicles, prompting strong reactions from Beijing. This decision is intended to protect European automakers from growing competition from Chinese manufacturers. Increased customs duties Currently, Chinese…

Launch of “carbon footprint” training in RFQs
SNECI, a family-owned services and consulting group specializing in international business development and industrial performance improvement, has joined forces with the FIEV (French Federation of Vehicle Equipment Industries) to launch a training course on how to respond to RFQ (Request…
SNECI: the expert for battery players in Europe
SNECI is an expert in the battery field and supports battery players in Europe. Batteries for Electric Vehicles: Exponential Needs. With the vote for the Fit for 55 plan and the ban on the sale of thermal vehicles in Europe…


